


The latest, richest and most authoritative information of NMS.
 Home >
Corporate News >
Crusher Performance Optimization – A Hands-on Approach to Improve Productivity
Home >
Corporate News >
Crusher Performance Optimization – A Hands-on Approach to Improve Productivity
 2020.12.04
As stated in the paper about cone crusher configuration the most important factor for controlling product gradation and shape is the closed side setting (CSS). Sooner or later the question arises: Is the crusher running on the best CSS? That is often a question left unanswered or answered that this is the way the crusher has always been operated.
To address optimizing the CSS this paper introduces a method that is useful in determining relation between productivity and CSS. It is based on sampling the crusher in question and is straight forward to conduct. It requires that some time is set aside, and that the crusher operation will be interrupted to take samples but in the end all the effort will be beneficial and could make a significant improvement in crusher productivity.
The method starts with planning, then moves on to sampling, analysis and finally optimization.
First of all, we will start by looking at the actual process. In this case the crusher is operated in closed circuit and produces 5 different products, see Figure 1.
Sampling of the crusher will be on the conveyor below the crusher, preferably as far away from the crusher as possible (You will understand why in the part section about taking samples). For safety reason make sure that the place you choose for sampling is safe to work at.
The sampling procedure is run the crusher at a specific CSS and take a representative sample. To make sure the sample is representative it is always good to have someone viewing the crusher. This person should make sure the crusher is fed properly and the operation is even. If, for example the power draw is stable before the crusher is stopped, it is a good indication that the operation is normal.
For selecting CSSs to sample it is a good idea to select at least 5 different. Selecting fewer will often make the result difficult to interpret. Trends based on a few points often tends to be misleading or confusing. Plan to take samples at the current setting and a series that stretches from a couple of millimeters smaller to a few millimeters bigger.
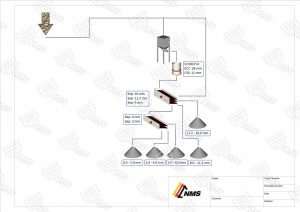
Figure 1. The crusher and surrounding process that is used to illustrate the optimization.
When taking samples there are a few things to pay attention to. Before starting the sampling serie take a couple of minutes to study the crusher operation and the surrounding process. Getting to know what normal is like will be beneficial during the tests.
The actual sampling starts with setting the crusher to the new setting and starting. Monitor that the crusher is operating normally and then stop the feed. When the crusher is getting near empty stop the crusher and conveyor. You do not want to stop the crusher with the chamber and hopper full. A crusher with the chamber full of material will probably not start before it has been cleared. This is also the reason why you should aim to take the sample as far away on the conveyor as possible. If you take the sample near the crusher the material will be from when the crusher was emptying, and it will not be representative.
From the conveyor, take the sample from a section with a defined length. Knowing the conveyor speed the weight can then be recalculated into crusher capacity. Taking a defined length will have a second advantage. If the total weight of the sample is measured, you should expect that the weight increases as the CSS gets bigger. If this trend is broken it is a clear indication that something is wrong with the test and it should be redone. So, after the sample is taken, measure the weight immediately.
Collect the samples in plastic bags, mark them carefully and send them to the lab. While doing the test keep a protocol where information about the crusher setting, sample weight, time of sample, and other useful information is noted.
The gradation curves when the result returns from the laboratory should look something like Figure 2.
The curves give a good overview of crusher production, but they are hard to use to optimize the crusher productivity.
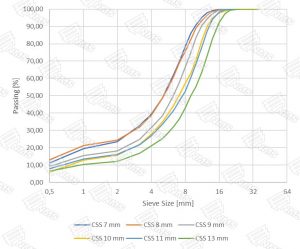
Figure 2. Gradation curves from the crusher running at different settings.
If it has not been done already the crusher capacity should also be calculated, it could also be plotted in a graph, see Figure 3.

Figure 3. Crusher capacity during the test with different CSSs
The collected data should be further processed to find the crusher’s production sweet spot. This is easiest done on a spreadsheet, like Microsoft Excel. The spread sheet used for this paper is available to download at the same location as this paper.
First step in this process is to calculate the produced percentage of each fraction, the result will look something like Figure 4
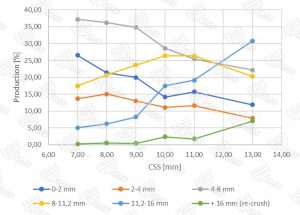
Figure 4. Produced percentage of each product at different CSSs.
Next step in the analysis is to combine the percentage of production with the total crusher throughput, see Figure 5
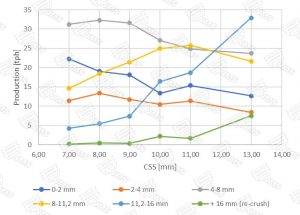
Figure 5. The production capacity of each product at different CSSs.
With this representation of the acquired samples it is possible to draw some conclusions about the crusher productivity. We can clearly see what a change in CSS does to each of our products. We can also start to make trade-offs between products. For example: If we increase the production of 4-8 mm by decreasing the CSS, we will know how much that will reduce the production of 11.2-16 mm.
As a final step we can assign a monetary value to each of the products as well. To demonstrate, the following values has been assigned to the different products, see Table 1:
Table 1. Value in an unspecified currency. Since +16 mm is re-crushed it has been assigned value 0.
|
Product |
Value |
|
0-2 mm |
5 |
|
2-4 mm |
30 |
|
4-8 mm |
15 |
|
8-11.2 mm |
20 |
|
11.2-16 mm |
10 |
|
+ 16 mm (re-crush) |
0 |
If the assigned values are combined with the graph in Figure 5 a new graph showing productivity can be produced, see Figure 6.
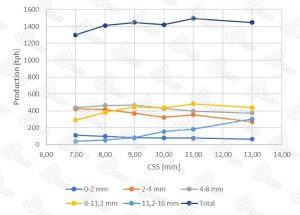
Figure 6. The productivity of each product and the total productivity. It is easy to identify that the optimum setting is 11 mm.
The graph has a total added to it so we can view the combined revenue from all products and identify an optimal setting, in this case CSS 11 mm. Of course, it is not as simple as setting the crusher at 11 mm, but it has a value to know that this is where the crusher is at its most profitable setting. Over time the crusher setting will need to be adjusted to meet the varying demand of different products but then we also know the loss it is causing. You can also use the graph to change the production to meet specific demands. So, if you come into a situation where more of a specific product is needed you know how to change the CSS and how much that will increase production of the desired product.
The purpose of this exercise has been to show how test data can be transferred into usable graphs that makes selection of crusher CSS less of a guess work. It is often talked about how important it is to keep the setting of a crusher, but it has no merit if the knowledge about what the best CSS is. With the developed graphs the CSS selection for a given situation becomes much easier and the crusher control system will start to become a tool to create and maintain profitability.
Since the example has been done in an unspecified currency it is hard to prove that this is worth the effort, but the experience is that even a small deviation from the optimum CSS has a significant impact on revenue. One should be aware of that for a production process that operates over many hours even a small hourly improvement will have big impact over time.


 Language
 中文
中文 English
 Español
 South Africa
 Previous:Research Group of China National Intellectual Property Administration Went to NMS for Intellectual Property Work
